2 Welcome
It’s a vast world out there. We’re going to cover a lot of ground. Don’t be scared. It’s going to be so. much. FUN!
I’m just playing right now and specifically thinking about code styling. So here’s a code chunk for producing a very basic plot.
# load the libraries
library(tidyverse)

# create a plot
ggplot(mpg, aes(displ, cty)) +
  geom_point() +
geom_smooth() 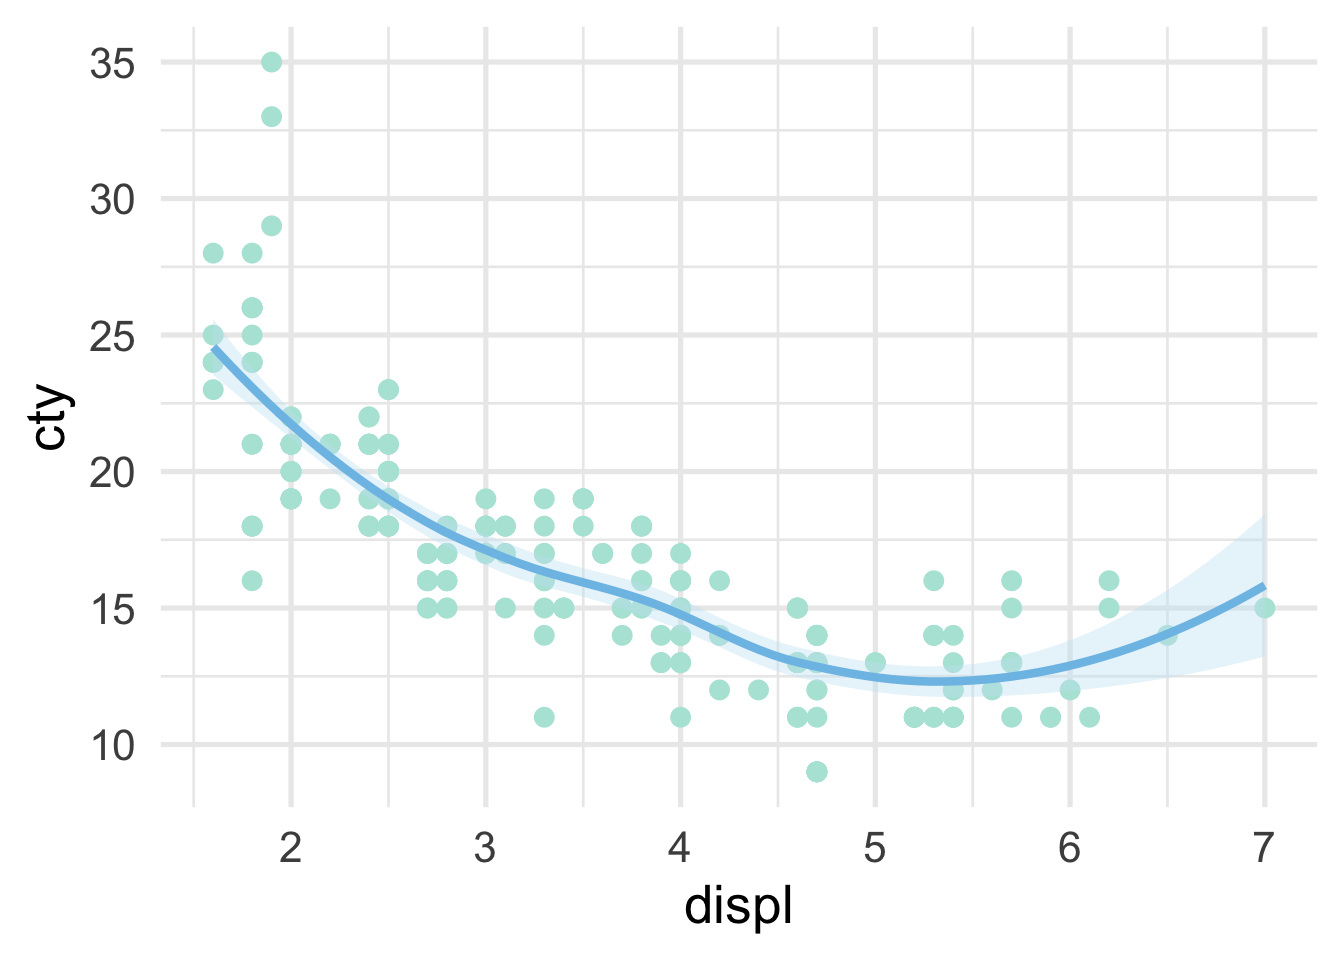
We could of course create some summary data too.
# create some summary data
mpg %>%
  group_by(cyl) %>%
  summarize(mean_cty = mean(cty),
            sd_cty = sd(cty))
## [90m# A tibble: 4 x 3[39m
## cyl mean_cty sd_cty
## [3m[90m<int>[39m[23m [3m[90m<dbl>[39m[23m [3m[90m<dbl>[39m[23m
## [90m1[39m 4 21.0 3.50
## [90m2[39m 5 20.5 0.577
## [90m3[39m 6 16.2 1.77
## [90m4[39m 8 12.6 1.81But the above doesn’t give us an example of a string, which we’ll also use a lot, so let’s try an example with that.
mpg %>%
  filter(manufacturer == "audi")
## [90m# A tibble: 18 x 11[39m
## manufacturer model displ year cyl trans drv cty hwy fl class
## [3m[90m<chr>[39m[23m [3m[90m<chr>[39m[23m [3m[90m<dbl>[39m[23m [3m[90m<int>[39m[23m [3m[90m<int>[39m[23m [3m[90m<chr>[39m[23m [3m[90m<chr>[39m[23m [3m[90m<int>[39m[23m [3m[90m<int>[39m[23m [3m[90m<chr>[39m[23m [3m[90m<chr>[39m[23m
## [90m 1[39m audi a4 1.8 [4m1[24m999 4 auto(l… f 18 29 p comp…
## [90m 2[39m audi a4 1.8 [4m1[24m999 4 manual… f 21 29 p comp…
## [90m 3[39m audi a4 2 [4m2[24m008 4 manual… f 20 31 p comp…
## [90m 4[39m audi a4 2 [4m2[24m008 4 auto(a… f 21 30 p comp…
## [90m 5[39m audi a4 2.8 [4m1[24m999 6 auto(l… f 16 26 p comp…
## [90m 6[39m audi a4 2.8 [4m1[24m999 6 manual… f 18 26 p comp…
## [90m 7[39m audi a4 3.1 [4m2[24m008 6 auto(a… f 18 27 p comp…
## [90m 8[39m audi a4 quat… 1.8 [4m1[24m999 4 manual… 4 18 26 p comp…
## [90m 9[39m audi a4 quat… 1.8 [4m1[24m999 4 auto(l… 4 16 25 p comp…
## [90m10[39m audi a4 quat… 2 [4m2[24m008 4 manual… 4 20 28 p comp…
## [90m11[39m audi a4 quat… 2 [4m2[24m008 4 auto(s… 4 19 27 p comp…
## [90m12[39m audi a4 quat… 2.8 [4m1[24m999 6 auto(l… 4 15 25 p comp…
## [90m13[39m audi a4 quat… 2.8 [4m1[24m999 6 manual… 4 17 25 p comp…
## [90m14[39m audi a4 quat… 3.1 [4m2[24m008 6 auto(s… 4 17 25 p comp…
## [90m15[39m audi a4 quat… 3.1 [4m2[24m008 6 manual… 4 15 25 p comp…
## [90m16[39m audi a6 quat… 2.8 [4m1[24m999 6 auto(l… 4 15 24 p mids…
## [90m17[39m audi a6 quat… 3.1 [4m2[24m008 6 auto(s… 4 17 25 p mids…
## [90m18[39m audi a6 quat… 4.2 [4m2[24m008 8 auto(s… 4 16 23 p mids…Finally, let’s write a quick function that has a logical in it (since we haven’t tested those yet).
mn <- function(x) {
  mean(x, na.rm = TRUE)
}
mn(mpg$hwy)
## [1] 23.44017And overall, I’m pretty happy with how that’s all looking.